
04 Sep Structure determination by Infrared Spectroscopy
Structure Determination using IR Spectroscopy
The major use of IR spectroscopy is in determining the structures of organic compounds.
In an IR spectrometer IR radiation in the range 400-4000 cm-1 is passed through a sample. The printout of the spectrum then shows which frequencies (wavenumbers) are absorbed.
IR spectra are always looked at with the baseline (representing 100% transmittance, i.e. zero absorbance) at the top. The troughs (usually called “bands”) thus represent wavenumbers at which radiation is absorbed.
Infra-red Spectrum of propanone
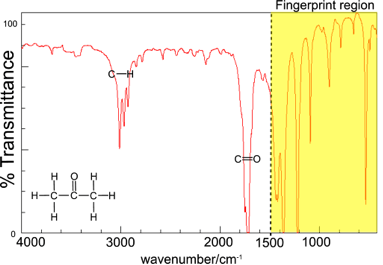
The infra red spectrum can be used to determine the bonds present in a molecule.
Thus, in the region above 1500 cm-1 in the IR spectrum of propanone there are two bands corresponding to the C-H stretch and the C=O stretch.
The region below 1500 cm-1 is called the “fingerprint region” and is characteristic of the molecule as a whole. Comparison of the spectrum in the fingerprint region with spectra in databases of IR spectra can be used to identify the molecule. e.g. the infra red spectra of butanone and propanone can be distinguished using the fingerprint region. They will both show very similar bands in the region above 1500 cm-1 because they have the same functional group but they will have different fingerprint regions.
We are usually interested in identifying the bonds/functional groups in an organic molecule. To a good approximation the various bonds in a molecule can be considered to vibrate independently of each other. The wavenumbers at which some bonds vibrate are shown in Table A.2.
| Bond | Functional Group | Characteristic range
wavenumber / cm-1 |
| C-Cl | chloroalkane | 600-800 |
| C-O | alcohol, ether, ester, carboxylic acid | 1000-1300 |
| C=C | alkene | 1610-1680 |
| C=O | aldehyde, ketone, carboxylic acids, ester | 1700-1750 |
| CºC | alkyne | 2100-2260 |
| O-H | hydrogen bonded in carboxylic acids | 2400-3400 |
| C-H | alkane, alkene, arene | 2840-3100 |
| O-H | hydrogen bonded in alcohols, phenols | 3200-3600 |
| N-H | primary amine | 3300-3500 |
Table A.2
| The precise wavenumber for a vibration for a particular functional group depends on the atoms adjacent to a particular bond thus C=O in a ketone will have a slightly different stretching frequency to C=O in an ester. |
We can use an IR spectrum to identify the bonds present in a molecule but cannot always distinguish between functional groups. For example, using Table A2 we could identify the presence of C=O in a molecule but would not be able to distinguish between an aldehydes and a ketone.
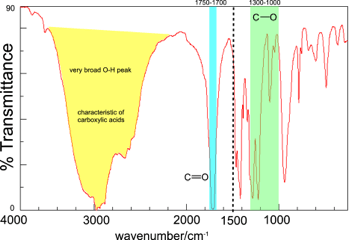
Consider the IR spectrum of butanoic acid shown.
In order to identify the bonds present in the molecule we first of all look at the region above 1500 cm-1.
| The C-H stretch also occurs in the region around 3000 cm-1 but this is usually mostly obscured by the broad O-H absorption.We now need to match up the wavenumbers of bands in the spectrum with the wavenumbers given in Table A.2. We can identify the C=O stretch as this absorption band occurs in the 1700 -1750 cm-1 region. The very broad absorption band between about 2400 and 3400 cm-1 is due to the O-H stretch in carboxylic acids and is very characteristic of carboxylic acids. The functional group of a carboxylic acid is |

| The broadness of the O-H band is due to hydrogen bonding between molecules. If the IR spectrum is taken of a carboxylic acid in the gas phase then the O-H band is much narrower. |
This contains a C-O bond and therefore we should now look in the fingerprint region to confirm the presence of an absorption in the region 1000-1300 cm-1, which is, indeed, the case. If there were no band in this region we would have to review our hypothesis that the molecule is a carboxylic acid.
| The region below 1500 cm-1 contains many absorptions due to C-C bonds and C-H bonds and is difficult to interpret. We usually only look at the fingerprint region to confirm the presence of a particular vibration once we have a good idea of what the structure of the molecule is. For example, a band in the 1000-1300 cm-1 region does not confirm the presence of a C-O in a molecule but the absence of a band in this region means that C-O is not present. For example, in the IR spectrum of propanone (Figure A.19) there are peaks in the 1000-1300 cm-1 region but no C-O. |
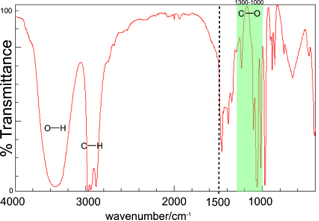
The IR spectrum of propan-1-ol is shown above:

Again, by comparison of the bands with the values in Table A.2 we can identify O-H (about 3350 cm-1) and C-H bonds (about 2900-3000 cm-1). A C-O bond should also be present and we can see that there is a band in the region 1000-1300 cm-1.
Sorry, the comment form is closed at this time.